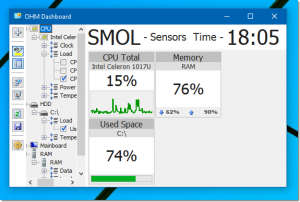
 The Open Hardware Monitor (“OHM”) is a free open source software that monitors temperature sensors, fan speeds, voltages, load and clock speeds of a computer. It can be downloaded from its homepage.
The Dashboard tool presented here is an add-on solution which requires OHM to be running in background. Dashboard is fully configurable and can present a set of Tiles with all the sensors data available from OHM. It is very suitable for second screens (at least 800×480 pixels) to monitor your PC performance and utilization in real time.
You can install such secondary display inside your PC case and run Dashboard on it as seen below.
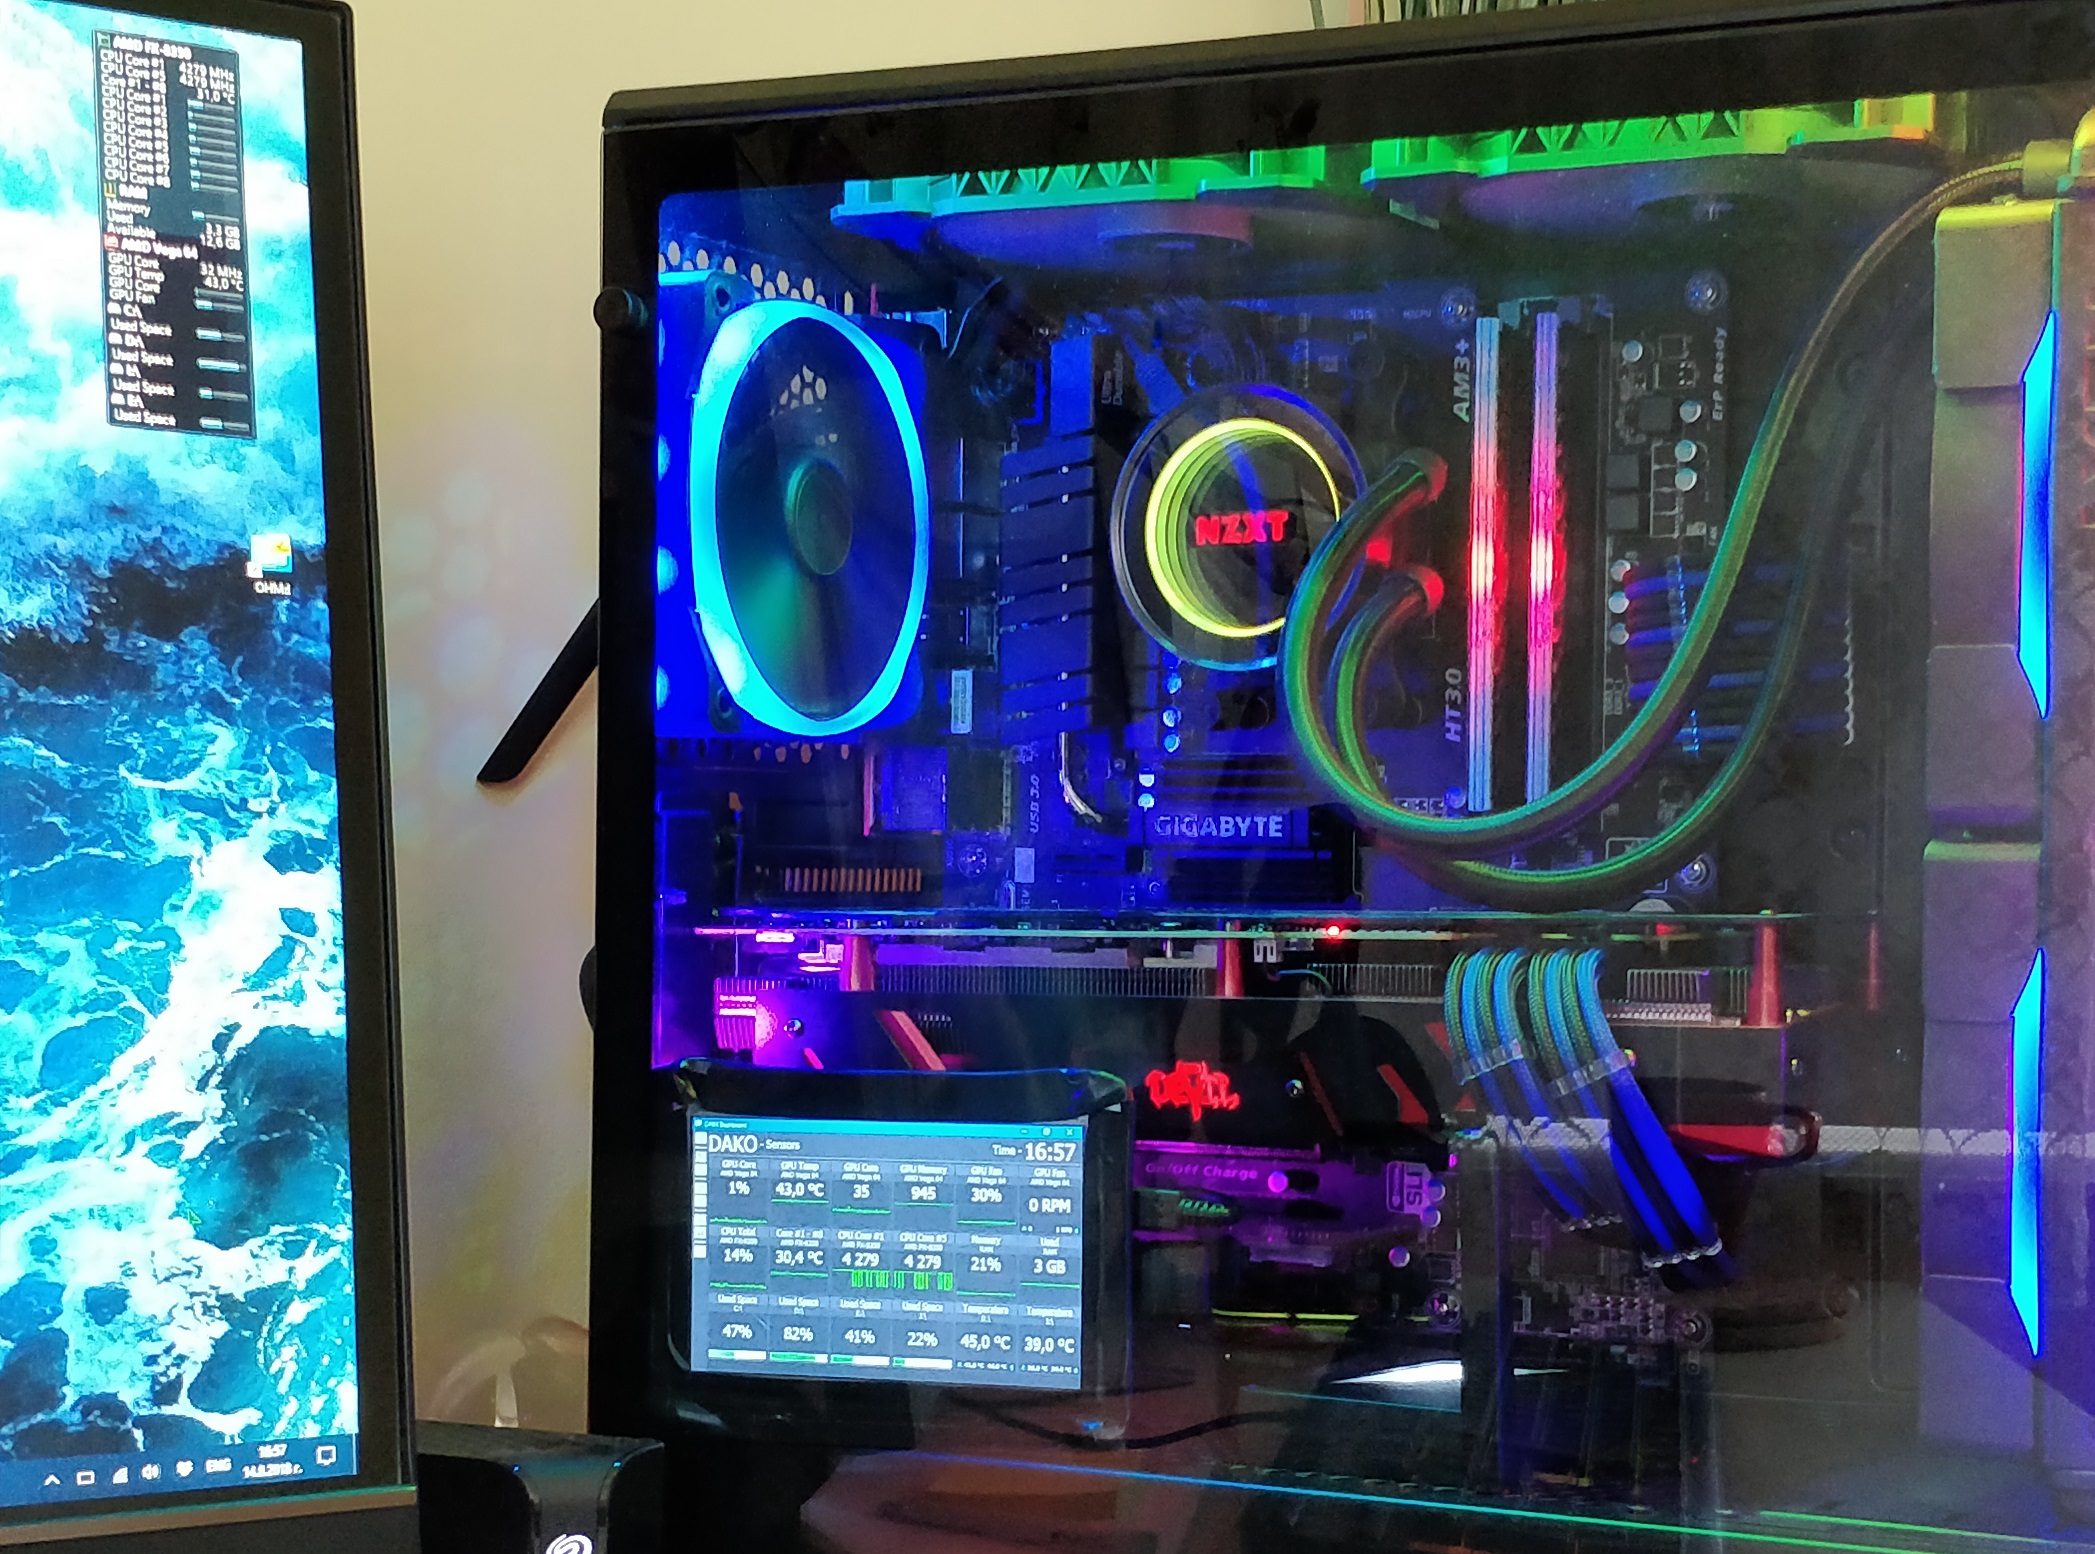
OHM running on the main display (widget visible in top corner).
Update Dec 17, 2022 — Major version update to 1.1 is bringing:
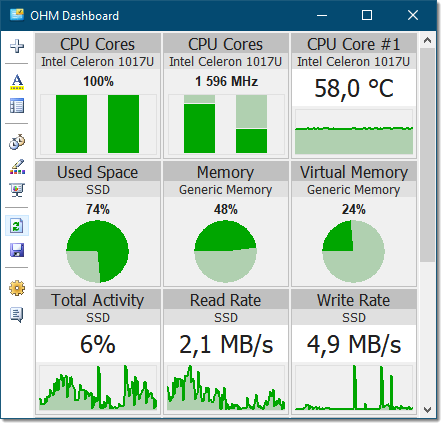
- new UI such as Pie and Bar chart types,
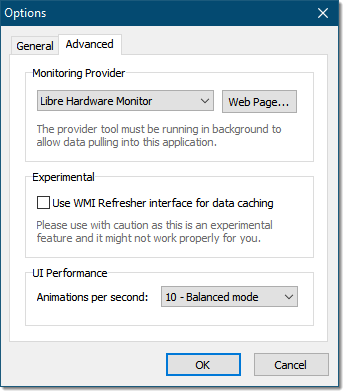
- new functionalities such as support for Libre Hardware Monitor, which is a fork of Open Hardware Monitor, but is being updated often,
- combined view of all peer sensors, i.e. All CPU Cores’ load.
Update Feb 13, 2024 — Major version update to 1.2 is bringing:
- new UI customization option for Title (show / hide),
- new UI customization option for Panel (left / right),
- new UI customization option for Bar colors (hold ALT key while clicking the Pen Colors icon),
- new UI icons for various popup menus,
- All charts are not centered in the main window by default,
- The main window can be mouse-dragged by clicking on the Title or Side Panel.
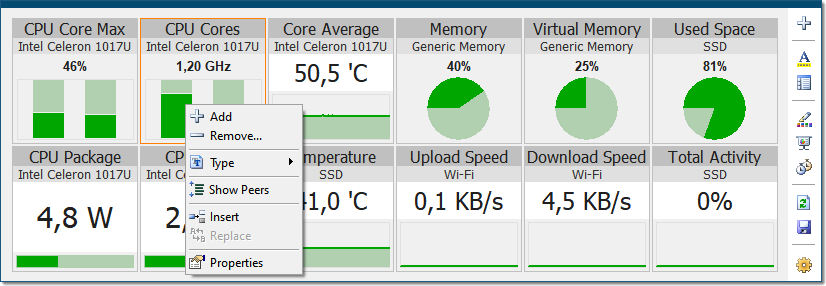
v1.2 Screenshots
The most recent download link is available under the Tools section.
This is perfect. I have almost an identical monitor setup in my phanteks case. Currently running CAM on it. Have to give this a try
Pingback: My Computer – Hardware Status – dakoSpace
A new tool is coming to replace OHMd. Check it out in here:
https://www.dakospace.net/2020/04/12/my-computer-hardware-status/